Data Methodology
Data Sources
PlainFoodAccess draws from three federal open-data programs:
- USDA ERS Food Access Research Atlas (2019 edition): The primary food-access dataset from the U.S. Department of Agriculture Economic Research Service, census-tract classifications combining supermarket proximity with income thresholds, the official federal measure of food-desert conditions. We use the 2019 release (the most recent), downloaded as the public Excel export and aggregated from its 71,700 tracts to the county level.
- U.S. Census Bureau American Community Survey (2024 5-year estimates): County socioeconomic context, population, median household income, poverty rate, SNAP participation (table B22010), and household vehicle availability (table B08201). Five-year estimates are used for county-level reliability.
- USDA FNS SNAP Retailer Locator (current-authorized stores): The per-store list of retailers currently authorized to accept SNAP (EBT) benefits, shown on each county profile grouped by store type. This extract currently holds 242,284 stores (a live store inventory, not folded into the FARA/ACS county aggregates). We keep only currently-authorized stores (no end date in the source file) and map each retailer's county/state to a 5-digit county FIPS code.
Download the data: the full county-level dataset is available as a CSV file covering all 3,144 counties (low-access share, food-desert population, SNAP participation, and vehicle access). The source figures are U.S. federal public-domain data; reuse is welcome with attribution to PlainFoodAccess.
How a county or state's food-desert rank is computed
Every county and state page states its position in the same low-access ranking that drives the public rankings and cartogram, so a reader can see how severe the gap is relative to the rest of the country, not just the raw share:
- Counties -
ROW_NUMBER() OVER (ORDER BY low_access_pct DESC, slug ASC)among counties with a positive Atlas low-access share, matching /rankings/worst-food-deserts. An in-state ordinal uses the same sort within the state's counties (same order as the state county table). - States - among states by population-weighted low-access share (DESC), the same basis as the national TileGridMap cartogram.
Each county and state page opens with that rank stated plainly, before the underlying FARA and ACS figures, because knowing whether a place is the 3rd-worst food desert in the country or the 2,800th changes how the raw percentage should be read. Ranks are recomputed live from the database on every request, not cached from a stale snapshot.
Data Vintage
PlainFoodAccess covers 3,144 U.S. counties. Food-access figures come from the 2019 USDA Food Access Research Atlas (the most recent edition; based on 2010 census-tract populations). Population, income, poverty, SNAP, and vehicle-access context come from the Census ACS 2024 5-year estimates. The two datasets carry different vintages and are labeled separately on every page. 11 areas, chiefly Connecticut's planning regions (which replaced its counties in 2022) and two re-drawn Alaska areas, have ACS data but no 2019 Atlas record, and are shown as "not available" rather than estimated.
Processing Pipeline
- The USDA ERS Food Access Research Atlas 2019 Excel export is downloaded from the ERS website (census-tract level, 71,700 tracts in the loaded database).
- Tract-level indicators are aggregated to each county by FIPS: low-access tract counts (USDA's
LA1and10flag), low-access population (LAPOP1_10), food-desert tract counts (LILATracts_1And10), and low-income low-access population (LALOWI1_10). - The USDA "food desert" designation, census tracts that are both low-income and low-access (more than 1 mile from a supermarket in urban areas, more than 10 miles in rural areas) - is preserved at the county level as a tract count and as the population share.
- Census ACS 2024 5-year estimates are joined to each county record: population, median household income, poverty rate, SNAP participation, and vehicle availability.
- The USDA FNS SNAP Retailer Locator file is filtered to currently-authorized stores (empty end date) and each retailer's county/state is mapped to a 5-digit county FIPS code, giving every county a real, varying-length list of stores that currently accept SNAP benefits.
- State- and national-level figures are computed as population-weighted shares, summing the low-access (or food-desert) population and dividing by total tract population, never an unweighted average of county percentages.
- All data is loaded into a structured SQLite database serving county profiles, state summaries, and national rankings.
Food Access Thresholds
PlainFoodAccess uses the USDA's official food access distance thresholds without modification:
- Urban areas: More than 1 mile from the nearest supermarket or large grocery store
- Rural areas: More than 10 miles from the nearest supermarket or large grocery store
- Vehicle access: Half-mile and 1-mile variants are also tracked for households without vehicle access
These thresholds come directly from USDA ERS definitions, no reclassification is applied.
Coverage
- Counties: 3,144 U.S. counties and county-equivalents
- States: All 50 U.S. states plus the District of Columbia
- Census tracts (Atlas): 71,700 tracts aggregated into county profiles
- Scope: U.S. domestic only
Update Frequency
PlainFoodAccess monitors both source agencies for new releases and updates the database within 30 days of each new publication. The USDA Food Access Research Atlas is updated periodically, not on a fixed annual schedule, with the most recent edition reflecting 2019 data. Census ACS five-year estimates are released annually, typically in December.
Like all federal statistical programs, there is inherent lag between the reference period and public release. Food access conditions on the ground may have changed since the most recent data vintage. We display the specific data vintage on every page so users can assess currency for their needs.
Data Accuracy Commitment
PlainFoodAccess presents government data as published, without modification or editorialization. We do not apply custom rankings, composite scores, or algorithmic adjustments to the underlying food access indicators. Where county data is missing or suppressed by the source agency, we display "Data not available" rather than interpolating values or showing zeros that could be mistaken for real measurements.
If you identify a potential data error, please contact us through the contact page or email hello@plainfoodaccess.com. We verify all reported anomalies against the original source data, issue corrections when warranted, and log material fixes on the changelog. See the editorial & corrections policy for turnaround expectations.
Data reuse, licensing & monetization posture
Readiness only, no paid products or affiliate units are live. This section inventories what is productized today so journalists, researchers, and future operators know the boundaries. Activating pricing, API keys, affiliate placements, or alternative ad networks requires explicit operator sign-off.
Downloadable & embeddable today
- plainfoodaccess-food-access.csv - the compiled county-level Atlas/ACS extract (low-access share, food-desert population, SNAP participation, vehicle access).
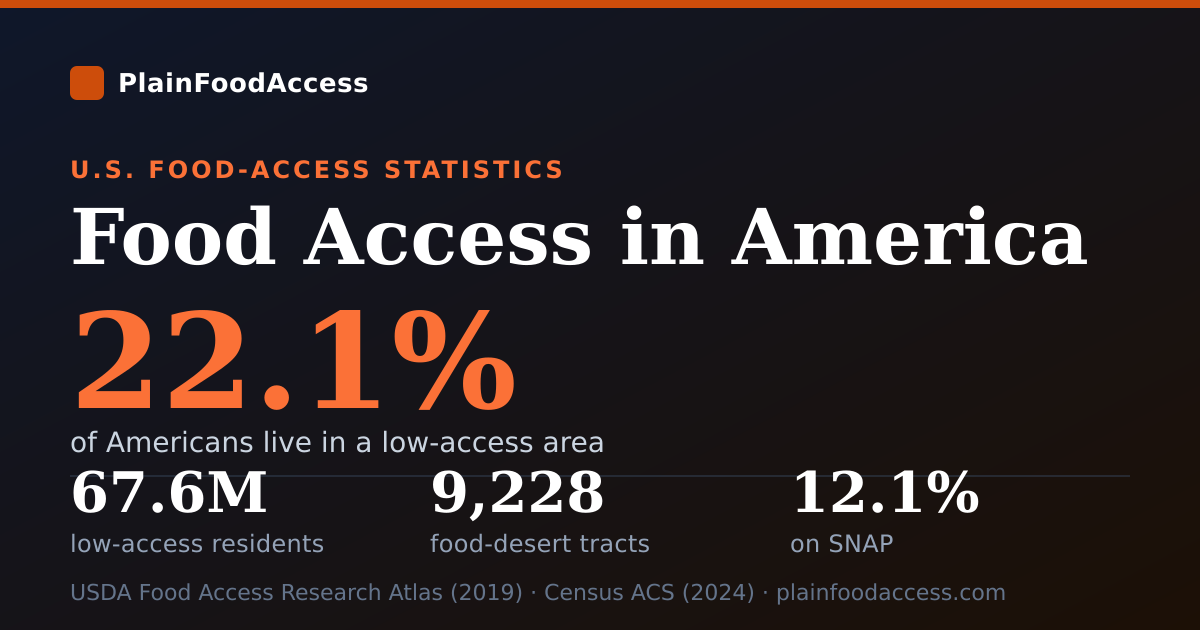
- /og/counties/[slug].png and /og/states/[slug].png - shareable summary images per county and state; /og/statistics.png for the national desk.
- /feed.xml - the site's editorial RSS feed.
- Per-page Cite this page blocks and Dataset schema on methodology, statistics, rankings, and detail pages, attribution-ready citation strings.
![/og/counties/[slug].png](/og/counties/abbeville-county-sc.png)
![/og/states/[slug].png](/og/states/california.png)
License & attribution
USDA ERS Atlas figures, Census ACS estimates, and FNS SNAP retailer locator rows are U.S. government works in the public domain. PlainFoodAccess's compiled county/state tables, rankings, and editorial framing are our own work, see Terms of Use (attribution + link back; no bulk scraping or competing redistribution without written permission).
Affiliate & ad placement rules (if ever activated)
No affiliate units run today; display ads are limited to labeled Google AdSense slots when approved. If the operator later enables additional monetization: units must be clearly labeled; no units may run adjacent to county/state food-access figures, SNAP retailer lists, or guide copy in a way that could read as personalized nutrition, benefits, or store recommendations, this is YMYL-adjacent food-security content, so that adjacency rule is strict; density must respect the fleet Module 36 ceilings shared with AdSense. We present federal open data; we do not sell groceries, benefits counseling, or health advice.
Alternative network eligibility (paperwork readiness)
Mediavine Journey and similar networks typically require roughly 1,000 real sessions per 28 days, original reference content, and a clean policy stack (privacy, terms, editorial policy, all present here). PlainFoodAccess is in Google AdSense GETTING_READY and currently measures on the order of a few hundred GA4 sessions / 28 days, below the Journey session gate. Counties similarity remains on a dated measurement clock; that fence does not paperwork-block an alternative-network application. Session volume is the readiness criterion this site has not yet crossed. [operator] No pricing page, API product, affiliate code, or second ad network is activated by this section.
Limitations
- Food access indicators are measured at the Census tract level and aggregated to counties, tract-level variation within a county is not visible in county profiles.
- The USDA food desert definition uses straight-line distance to supermarkets, not actual travel time or transit access. Real-world travel barriers may be more severe than distance alone suggests.
- SNAP participation data may lag behind current conditions due to federal reporting timelines and annual publication cycles.
- Supermarket locations used in food access calculations come from USDA sourcing and may not reflect store openings or closures since the most recent Atlas release.
- The food desert framework focuses on proximity to supermarkets and does not account for food quality, pricing, cultural food availability, or informal food networks such as community gardens and food pantries.
- PlainFoodAccess is not affiliated with the USDA, Census Bureau, or any government agency.
Download the county food-access extract cited on this page: plainfoodaccess-food-access.csv (USDA ERS Food Access Research Atlas + Census ACS · public domain sources).